
Infrastructure plays a decisive role in stimulating long-run economic growth. An increase in the level of infrastructure stock directly helps in reducing poverty and accelerating productivity. Infrastructure also contributes to the development process through the provision of intermediate consumption items for production as well as final consumption services for households. It contributes to growth through generating new jobs, creating cohesive spillover benefits and attracting further investments through crowding in effects. Empirical studies also corroborate the relationship between different infrastructural indicators and growth.
In the present article, we have constructed an Infrastructure Index to observe the growth-infrastructure nexuses from a broader perspective. With a view to observing nexus, we have constructed the Infrastructure Index for 133 countries over the period between 1990 and 2012 using four indicators namely Electric Power Consumption (per kWh per capita), Energy Use (kg of oil equivalent per capita), Fixed Broad Internet Subscribers (per 100 people) and Mobile Cellular Subscriptions (per 100 people). The indicators are selected based on the availability of data and importance. We have obtained the data of these selected indicators from the World Development Indicators (WDI) of the World Bank. In order to assign a weight to each indicator to construct the Infrastructure Index, we have applied the Principal Component Analysis (PCA) method as it enables us to derive the weight for each variable associated with each principal component and its associated variance explained. In doing so, firstly, we have used normalized values of variables followed by the extraction of factors. Secondly, the Eigenvalues of the factors, which help to determine the significance of principal components, have been used to determine the factors that will be retained. Thirdly, the variables have been assigned weights, which have been calculated by multiplying factor loadings of the principal components with their corresponding Eigenvalues. And, finally, the index has been constructed using those weights. The constructed Infrastructure Index ranges from 0 to 100 where 0 depicts the worst case and 100 depicts the perfect case. The PCA suggests that the weights for electric power, energy use, internet use, and mobile subscriptions were 29.9%, 37.6%, 16.3% and 16.2% respectively in 1990; 30.1%, 36.5%, 15.8% and 17.6% respectively in 2000; and 31.4%, 33.8%, 19.4% and 15.4% respectively in 2010.

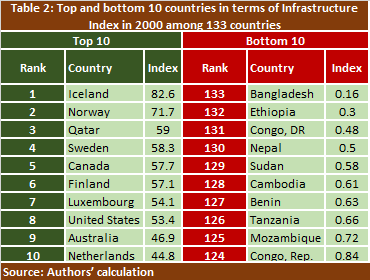
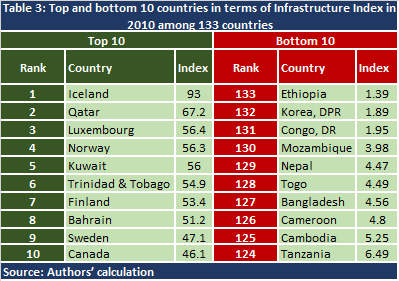
Tables 1, 2 and 3 depict the top 10 and bottom 10 countries in terms of the Infrastructure Index for the years of 1990, 2000, and 2010 respectively. Norway ranked at the top in 1990 while Iceland ranked at the top in both 2000 and 2010. Among the 133 countries considered, Bangladesh ranked the lowest invariably in both 1990 and 2000 whereas, Ethiopia ranked the lowest in 2010. The ranking of the South Asian countries (Table 4) shows that Pakistan ranked 110th in 1990, the highest among the five South Asian countries; while Sri Lanka ranked 108th and 103rd respectively in the following two consecutive decades, the highest among the five South Asian countries. It should be noted that the South Asian countries’ rank as some of the bottom-most countries clearly indicates dissatisfactory performance in their infrastructure development. This poor performance clearly depicts that the region has huge electricity shortages and very low energy use, which together takes into account more than 60% weight of the Infrastructure Index.

In order to explore the association between infrastructure and economic growth, we have run a series of fixed effect panel regressions where Infrastructure Index and its sub-components are treated as infrastructure capital. We have followed the production function approach in the cross-county growth regressions where aggregate output Y at time t is produced using other capital, infrastructure capital, and labor. Our data covers the time period between 1990 and 2011 and we have a balanced panel data set. We have chosen a long panel over other models as infrastructure is expected to have a long-term effect on growth. The output is measured as real GDP at constant 2005 national prices (in million 2005 US$), other capital is measured as capital stock at constant 2005 national prices (in million 2005 US$), and labor is measured as the number of persons engaged (in millions). The data of real GDP, capital stock and labor is obtained from the Penn World Table 8.1. We have taken a natural logarithm for all variables except the infrastructure variables.
We have carried out five individual sets of fixed effect regressions. The first set of regressions included real GDP, the Infrastructure Index, capital stock, and labor. The result shows the strong, statistically significant and positive relationship of labor, capital stock, and Infrastructure Index with real GDP: a 10% increase in labor supply increases real GDP by 3.5%; a 10% increase in capital stock increases real GDP by 6.2% while a 10 unit increase in the Infrastructure Index raises real GDP by 1%. Analogous to the first set of regressions, in all of the successive regressions, after controlling for capital stock and labor, we find a highly significant influence of sub-components of the Infrastructure Index over real GDP growth. It is observed that a 10 unit increase in the electric power consumption raises real GDP by 1.3%; a 10 unit increase in the energy use raises real GDP by 1.7%; a 10 unit increase in the fixed broad internet subscribers brings about 1.6% increase in real GDP; and finally, a 10 unit increase in the mobile cellular subscriptions boosts real GDP by 1.6%.
Furthermore, to capture the regional differences between ‘South Asia’ (SA) and ‘East and South-East Asia’ (ESEA) with regard to the impact of infrastructure overgrowth performances we have carried out regressions using a least-squares dummy variable model (LSDV). It is observed that in the case of South Asia a 10 unit increase in Infrastructure Index results in a 3.1% rise in their real GDP, whereas, a 10 unit increase in Infrastructure Index results in a 1.2% increase in real GDP in ESEA. A reason for such a difference in the size of the coefficients may be due to the differences in the level of development of infrastructure between SA and ESEA. As SA is well behind ESEA in terms of infrastructure development, improvements in infrastructure will bring about a larger positive effect on growth in SA than in ESEA.
The aforementioned analysis points to the fact that improvements in infrastructure significantly contribute to economic growth, and therefore, investment in infrastructure is an essential pre-requisite pediment. Hence, to opt for the ‘inclusive growth’ agenda, supply-side bottlenecks should be addressed promptly. Priorities should be given to the development of infrastructures that can create highly adhesive ‘crowding in’ effect for private sector investment.
This article is written by Dr. Selim Raihan and Sunera Saba Khan.


RECENT COMMENTS